Before you start: you need a compatible broker, US market data, suitable trading capital, and time to review signals and place any required orders. Leveraged ETFs carry significant risk, including possible loss of capital. General information only.
Beyond Charts / SPA3 Income
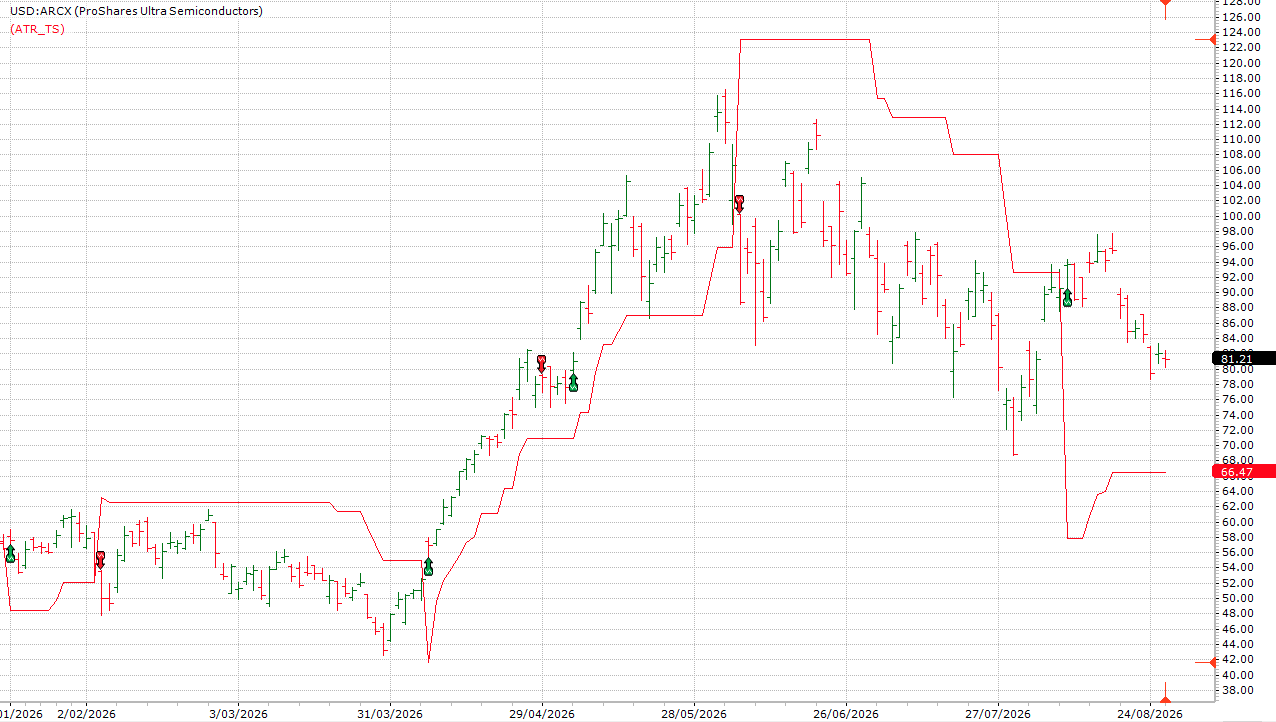
TQQQ / Market-on-close signal view
Glass box
31US leveraged ETFs
5max open positions
30mtypical weekly time
The real problem
Most Traders Do Not Fail Because Markets Are Impossible to Beat.
The problem is execution. When the market moves, rules get negotiated, exits get delayed, and opinion starts to replace process.
The market punishes inconsistency, not effort.
01 Hesitation
A sell signal appears, but the trader waits for the market to feel safer.
02 Override
A clear rule becomes a debate because the latest chart looks convincing.
03 Over-checking
More screen time creates more noise, not better execution.
04 Process
SPA3 Income turns analysis into a defined action: follow the signal.
The system
A Mechanical Trading System That Tells You Exactly What to Do
SPA3 Income scans 31 US-listed leveraged ETFs and generates objective buy and sell signals. No interpretation. No gut call. The system tells you what the signal is. Your job is to execute it.
TSTrading styleLong-only, trend-following swing trading. No shorting into uncertainty.
31Market universe31 liquid US-listed 2x and 3x leveraged ETFs.
MOCExecutionMarket-on-close orders. Simple, repeatable, no open-watching required.
30Time requiredAbout 30 minutes a week once the process is learned.
Transparency
CB Glass Box, Not Black Box
Every rule that governs entry and exit is visible to members. You know why a signal fires. Nothing is hidden behind a manager's discretion.
Technical engine
ATR Breakouts, Stops, and Profit-Taking Rules
Entries use volatility breakouts to identify momentum shifts. Exits use trailing stops, overbought profit-taking, and weakness rules.
Delivery
BC Delivered Through Beyond Charts
You see the signal on the chart, execute it, then track the portfolio. The platform carries the analysis so you can focus on behaviour.
Weekly rhythm
30 About 30 Minutes a Week
Check signals, confirm open positions, place any market-on-close orders, and record the outcome. That is the weekly rhythm.
Rainy Day Framework
Income Does Not Come From Every Month Being Profitable.
It comes from trading properly and managing capital properly over time. SPA3 Income is designed around high growth when conditions are strong, protection when they are not, and a reserve that can fund withdrawals during flat or losing periods.
1
Trade for growth
When markets trend and signals fire, the portfolio compounds. This is where returns are built.
2
Reset base capital
As the portfolio grows beyond your starting capital, periodically lock in gains by resetting your base.
3
Fund the reserve
Move excess profits into a separate rainy day account. That reserve becomes your income buffer.
4
Draw from reserve
During drawdowns, income comes from the reserve, not forced trades or broken rules.
01Trading PortfolioSignals fire when conditions justify exposure.
02Excess ProfitGains above the reset base are separated.
03Rainy Day ReserveThe buffer sits outside the active trading account.
04WithdrawalsIncome can come from reserve during flat periods.
The system does not promise consistent monthly income. It builds a structure where consistent income becomes possible over time, without needing to be right every month.
For retirement-stage investors: this is why SPA3 Income belongs as a satellite strategy, not a replacement for your core portfolio.
SPA3 Income - Simulations
SPA3 Income Historical Simulations
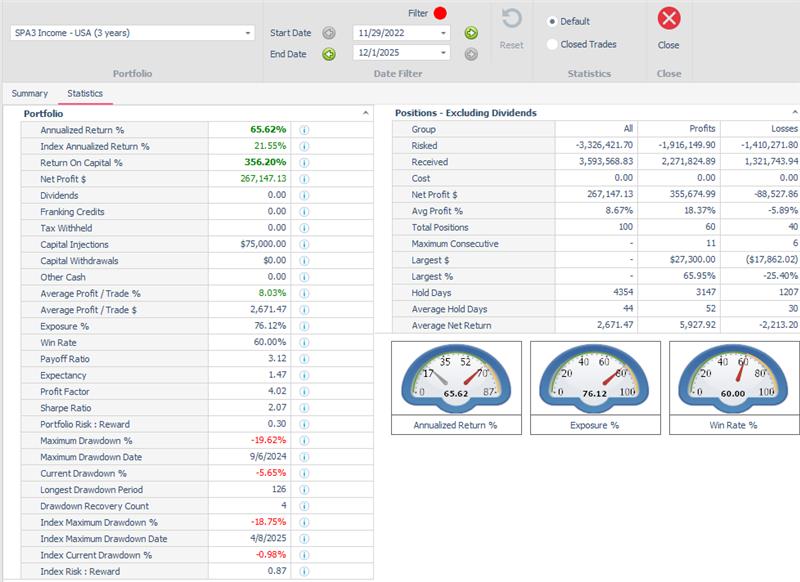
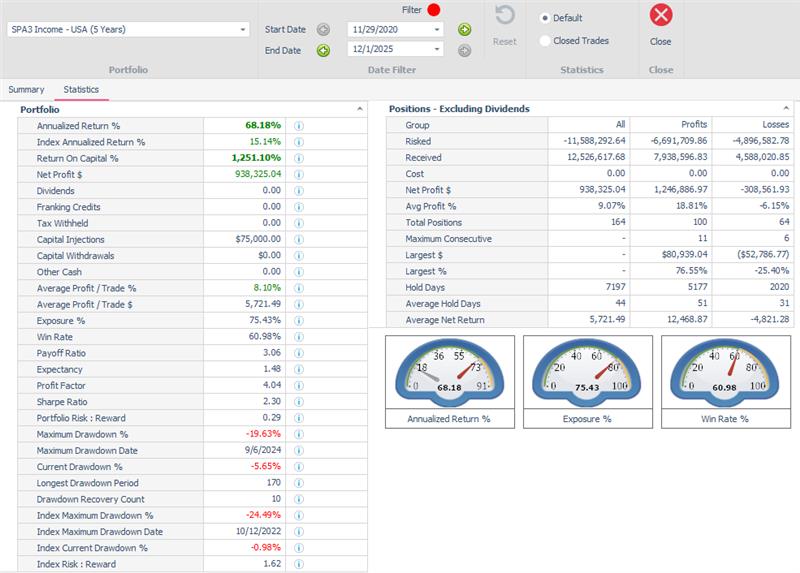
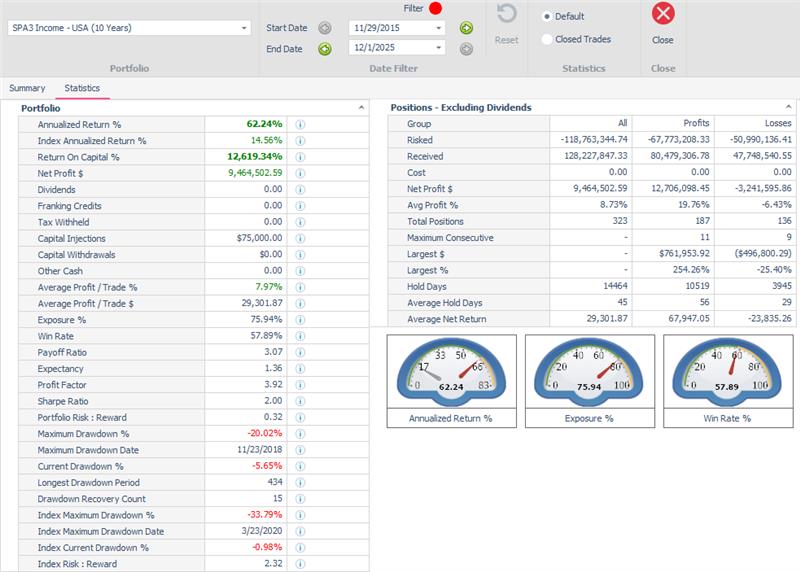
The simulations below show how SPA3 Income would have performed using historical market data across different time periods.
November 29, 2022 to December 1, 2025
November 29, 2020 to December 1, 2025
November 29, 2015 to December 1, 2025
These simulations are provided for illustrative purposes only and are based on historical market data and the assumptions shown above. They are not actual trading results and do not predict future performance. Trading involves risk, including the risk of loss. Individual results will vary. General advice only. Past performance is not indicative of future results.
Is this for you?
SPA3 Income Is for Investors Ready to Trade Mechanically
YES This Is For
Investors who want leverage exposure without margin interest.
Traders who prefer long-only simplicity over options complexity.
Time-poor people who still want active involvement.
Stage 2 and Stage 3 investors using a satellite strategy.
Anyone ready to replace gut feel with execution rules.
Investors unwilling to follow rules through discomfort.
Those building execution skills start with 1-2% of investible capital while they learn. Scale belongs to traders who can follow rules through drawdown.
Open-book track record
Real money. Real drawdowns. Measured against the index.
Real money, traded live since 15 December 2025 across a universe of 31 US leveraged ETFs. Eight and a half months of record — short, and shown in full, drawdown included.
Portfolio value
US$212,401
from US$163,158 on 15 Dec 2025
Net profit
US$50,200
30.77% return on capital
Return since inception
30.77%
8.5 months — not annualised
Versus the index
+17.39 pp
S&P 500 TR 13.38%
These records are provided for transparency. Trading leveraged ETFs involves risk, losses and drawdowns. Objective rules can structure entries, exits, position sizing and risk responses; they cannot remove the possibility of loss. General advice only. Past performance is not indicative of future results. AFSL 250900. Individual results vary.
Performance — SPA3 Income
As at 31 Aug 2026
Returns
After brokerage, in US dollars
Period
Portfolio
S&P 500 TR
1 month
−1.77%
+2.47%
3 months
−7.59%
+1.03%
6 months
+39.57%
+12.05%
1 year
n/a
n/a
3 years p.a.
n/a
n/a
5 years p.a.
n/a
n/a
10 years p.a.
n/a
n/a
Since inception
30.77%
13.38%
Inception date
15 Dec 2025
—
Starting capital
US$163,158
—
⚑Data gap. Trailing periods pending — Income has no daily equity-curve export yet.
15 Dec 2025 → 31 Aug 2026
SPA3 Income versus S&P 500 TR. Portfolio +30.77%, index +13.38%. Full figures are in the tables on this page.
✓187 daily observations. Plotted directly from the SPA3 Income equity-curve export — portfolio and benchmark, 15 Dec 2025 to 2 Sep 2026.
These records are provided for transparency. Trading leveraged ETFs involves risk, losses and drawdowns. Objective rules can structure entries, exits, position sizing and risk responses; they cannot remove the possibility of loss. General advice only. Past performance is not indicative of future results. AFSL 250900. Individual results vary.
Risk and return vs the index
Benchmark: S&P 500 Total Return ($SPXTR)
Head to head
Measure
Portfolio
S&P 500 TR
Return since inception
30.77%
13.38%
Maximum drawdown
−15.48%
−8.89%
Max drawdown date
10 Mar 2026
30 Mar 2026
Current drawdown
−7.59%
−1.62%
Risk : Reward — lower is better
0.50
0.66
Longest time underwater
92 days
—
Sharpe ratio
1.34
—
The edge mechanics
Win rate
42.42%
14 winners of 33 closed
Payoff ratio
3.00
avg win +21.91% · avg loss −7.30%
Profit factor
2.01
US$98,637 gross profit ÷ US$49,043 gross loss
Avg profit / trade
+5.09%
US$1,503 per position
Average hold
29 days
winners 38 · losers 24
Time in market
71.25%
the rest sits in cash
Expectancy
+0.70 R
per trade, across 33 trades
Positions taken
33
14 wins · 19 losses
On a short record and a real drawdown
Eight and a half months is a start, not a track record — read it that way. In that window the portfolio returned 30.77% against the index's 13.38%, and it did that while spending as long as 92 days underwater in a single stretch — one it is still in — and falling 15.48% from its high on 10 March 2026.
One trade carries a lot of that number. A single SOXL position returned +164.38% and US$51,706 in 32 days — more than the portfolio's entire net profit of US$50,200. Strip it out and the record is a loss. That is what a small sample looks like, and it is why eight months of leveraged-ETF returns should not be read as a rate of return you can expect.
The portfolio currently sits 7.59% below its peak. That is published here for the same reason the 30.77% is. You cannot judge a system on the half of the record that flatters it.
These records are provided for transparency. Trading leveraged ETFs involves risk, losses and drawdowns. Objective rules can structure entries, exits, position sizing and risk responses; they cannot remove the possibility of loss. General advice only. Past performance is not indicative of future results. AFSL 250900. Individual results vary.
How the edge actually works
Every closed trade, counted
Where every trade landed
< −30%
0
−30 to −20
1
−20 to −10
6
−10 to 0
12
0 to +10
9
+10 to +20
2
+20 to +30
1
+30 to +50
1
+50 to +100
0
> +100%
1
All 29 closed trades, grouped by result. The tall bar is the point: most losses are small ones.
How long each kind was held
Winners held
38 d
Losers held
24 d
Winners are held 1.6× longer than losers. Nothing decides that but the rules.
Most trades lose a little. A few win a lot. The system's only job is to make sure the second group is held long enough to outweigh the first — which is why the win rate can sit below 50% and the portfolio still compounds.
The best trades and the worst trade
All of them are on the record
Largest single win
+US$51,706
SOXL · +164.38% in 32 days
Largest single loss
−US$7,343
YINN · −21.22%, exited on the rule
These records are provided for transparency. Trading leveraged ETFs involves risk, losses and drawdowns. Objective rules can structure entries, exits, position sizing and risk responses; they cannot remove the possibility of loss. General advice only. Past performance is not indicative of future results. AFSL 250900. Individual results vary.
Open positions are not published. Closed trades only, newest first. Results are price-only after brokerage; dividends are counted separately in portfolio net profit. Current holdings stay inside the platform, with customers.
These records are provided for transparency. Trading leveraged ETFs involves risk, losses and drawdowns. Objective rules can structure entries, exits, position sizing and risk responses; they cannot remove the possibility of loss. General advice only. Past performance is not indicative of future results. AFSL 250900. Individual results vary.
The entry offer
Profit Before You Pay (PBYP)
PBYP lets you begin with the US$99 monthly data-and-support subscription; the full fee is invoiced only after the LTTP reference portfolio reaches the stated +US$2,495 milestone.
Pricing
$0upfront
US$99/month for market data and unlimited support.
$2,495deferred
The deferred fee is only triggered when the SWS reference portfolio reaches US$2,495 profit.
What you get with PBYP
SPA3 Income signals via Beyond Charts from day one.
LTTP training using SPA3 Income as the live-trading vehicle.
Weekly practice targets and study group sessions.
Entry, exit, sizing, drawdown, and recovery coaching.
Trade journal and review framework to build consistency.
Eligibility path that transitions you to the purchased product.
The offer in plain English
1. StartPay US$99/month for access, market data, and support.
2. TradeFollow SPA3 Income alongside the SWS reference portfolio.
3. MilestoneThe US$2,495 fee triggers only at +US$2,495 reference profit.
4. DecideYou have 14 days to continue or walk away. No lock-in.
Gary Stone Has Traded This System for Decades. You See Every Trade He Makes.
Gary Stone has spent decades building and trading rules-based systems. He does not sell a black box. He runs a glass box: every rule, every signal, and every trade is visible — including his own.
1998
Founder, Share Wealth Systems
AFSL 250900
Licensed Australian financial services business
Since 1990
Active in the markets
8,000+ hours
Trading system R&D
Customer proof
From Investors Who Made the Same Decision You Are Considering
*****
Training plus support
"Share Wealth Systems is not just a trading system. There is a huge amount of training material, webinars and support to improve your investing knowledge. I highly recommend Gary Stone and his team."
James McCracken Australia
*****
Less guesswork
"Beyond Charts is a purely mechanical system for share trading/investing, which is great because it takes the guesswork and stress out of something that would otherwise involve subjective decision-making."
Tony Cooper Australia
*****
Experienced coaching
"David is personable, has a wealth of experience and always ensures he spends the time needed with you to coach and solve any problems you may have."
Tony O'Brien Australia
Questions
Common Questions About SPA3 Income
Short answers for the decisions most visitors need to make before starting.
How much experience do I need?
Some market experience helps. You should be comfortable using a brokerage platform and allocating capital to a satellite trading strategy.
What markets does SPA3 Income trade?
It trades 31 US-listed leveraged ETFs, including 2x and 3x instruments such as TQQQ, SOXL, and SPXL.
How much time does it take each week?
About 30 minutes per week once learned: check positions, review signals, and place any required market-on-close orders.
What is PBYP?
Profit Before You Pay (PBYP) gives access at US$99/month. The US$2,495 fee triggers only when the SWS reference portfolio reaches +US$2,495 profit.
What if the system goes through a losing period?
Drawdowns are normal. LTTP supports execution through drawdowns, while the Rainy Day framework avoids forcing income from weak periods.
Two ways to start
Two Ways to Start. One Is Free.
Profit Before You Pay
US$99/month. Access SPA3 Income, trade alongside the reference portfolio, and only pay the full US$2,495 when the LTTP reference portfolio reaches +US$2,495 profit.
Gary's free 7-part PBYP Series walks through the system, the offer, and the training — at your pace, before you decide anything. Watch the PBYP Series free.