
Mechanical Investing for the Decade That Matters Most
A rules-based ASX and USA stock investing system for Stage 2 and Stage 3 investors: the years where timing, discipline, and capital protection matter most.
Before you start: you need a compatible broker, market data, suitable investing capital, and time to review signals and place any required orders. The ASX live portfolio's maximum historical drawdown was -22.70%; the US live portfolio's was -36.38%. Active investing involves risk, including possible loss of capital. General information only. AFSL 250900.
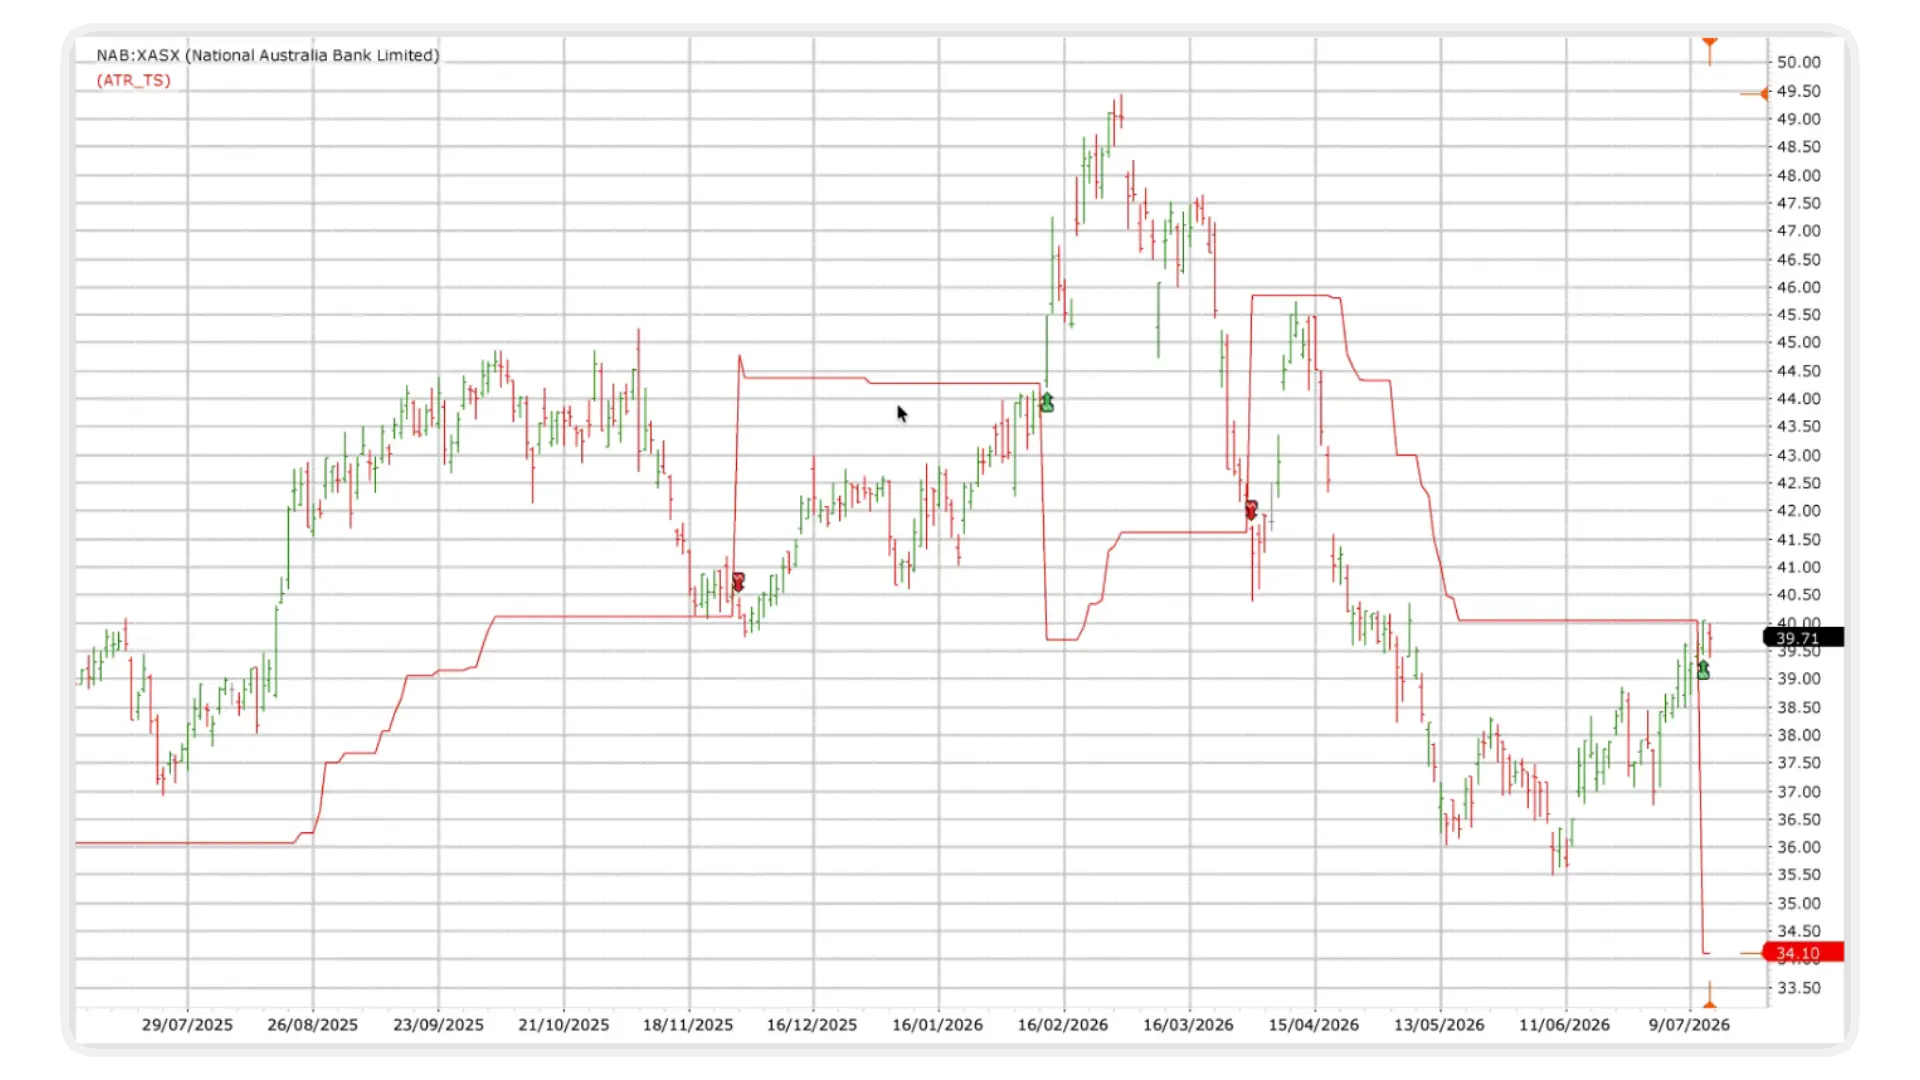
There Is One Risk That No One Talks About Enough.
If a major bear market arrives just before retirement, or just after you begin drawing from savings, the damage is disproportionate. The math changes. The recovery timeline changes. The stakes change.
Before Retirement
Your capital is largest and your recovery window is shortest. A bad decline hurts more here than it did at 35.
Bear Market Hits
Drawdowns can collide with withdrawals or retirement timing, turning a temporary market event into a permanent planning problem.
Recovery Time
SPA3 Investor is designed to reduce exposure when trend rules break, then re-engage when new signals appear.
A Rules-Based Investing System With Market Timing Built In
SPA3 Investor is a mechanical trend-following strategy for ASX and USA stocks and ETFs. It turns the core decisions into a visible process: enter, size, monitor, exit, wait.
How SPA3 Investor works at a glance.
It Can Move to 100% Cash
When all positions have closed by the rules, the portfolio waits in cash until new entry signals appear.
Every Rule Is Visible
Every entry rule, exit rule, and signal criterion is visible inside Beyond Charts before you execute.
Not Retrofitted for Retirement
Built for investors who still need growth, but cannot ignore major drawdown risk.
Execution, Not Prediction
You cannot control the market. You can control the process you use to respond to it.
Most Investing Strategies Were Not Designed for Your Stage of Life.
A 40% decline at 35 is painful. The same decline at 60 can permanently alter the plan. SPA3 Investor does not predict bear markets; it responds when trend evidence breaks.
SPA3 Investor Historical Simulations
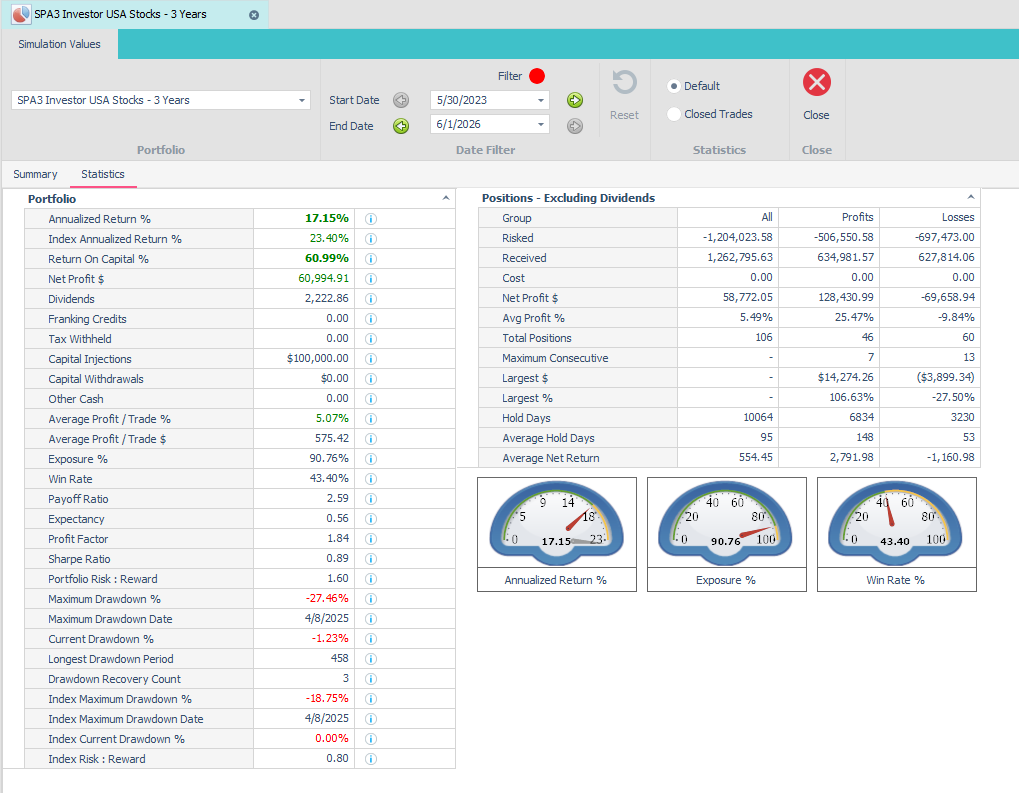
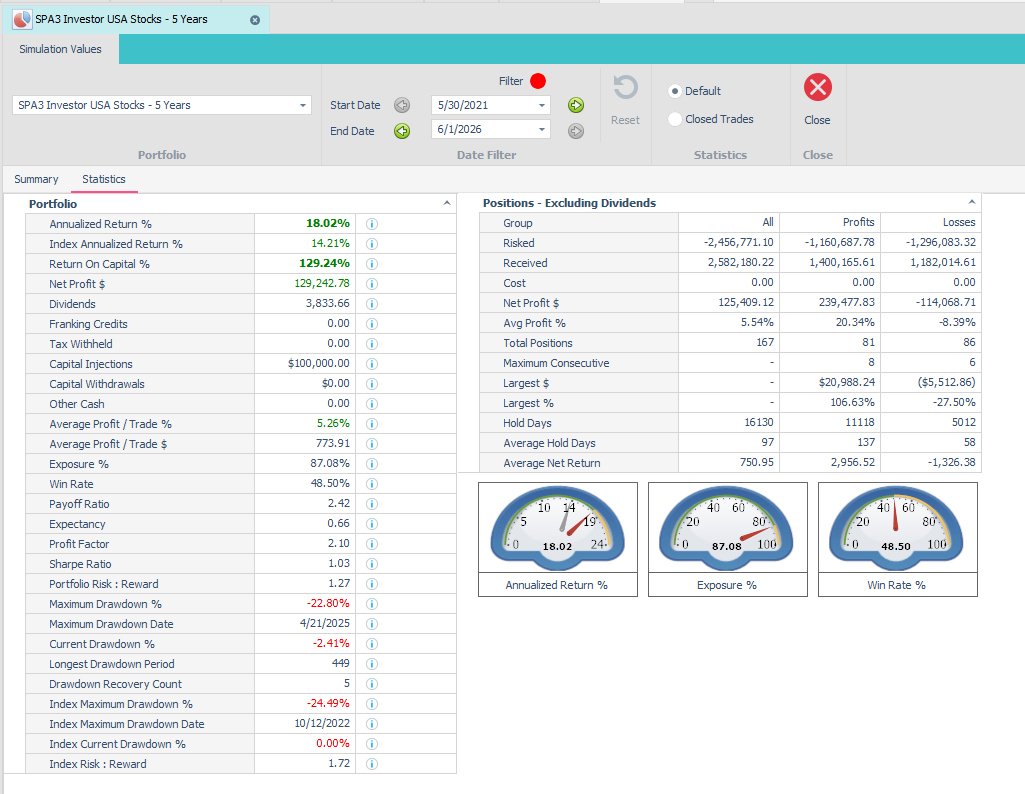
The simulations below show how SPA3 Investor would have performed using historical market data across different time periods.
May 30, 2023 to June 1, 2026
May 30, 2021 to June 1, 2026
May 30, 2016 to June 1, 2026
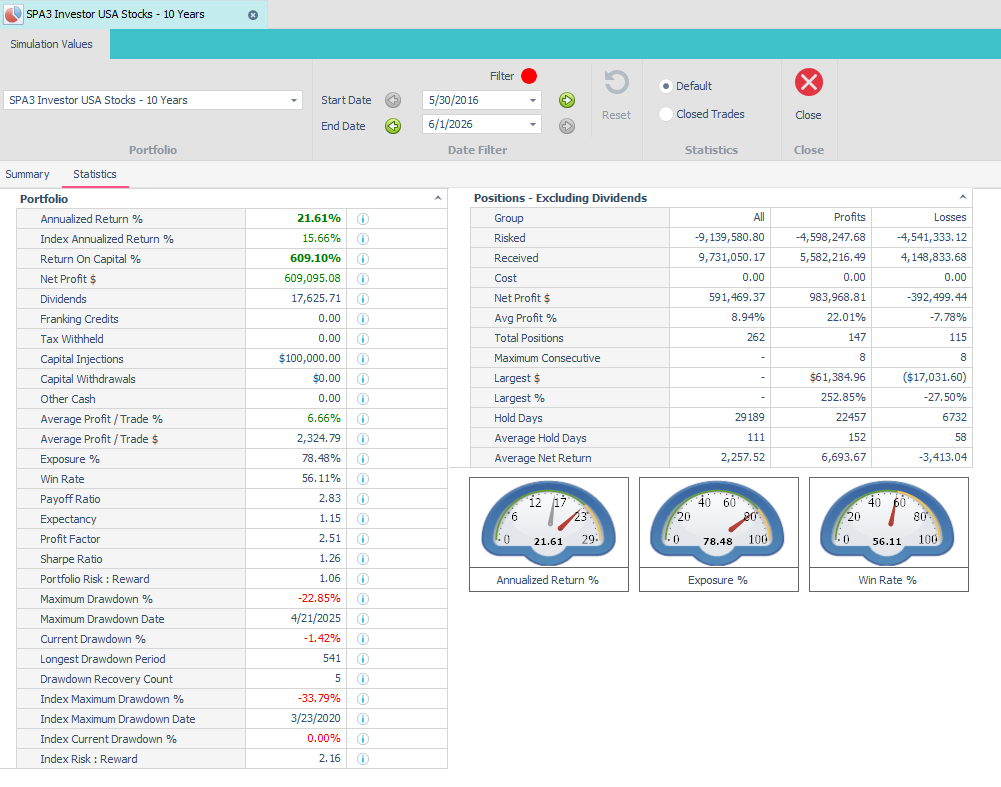
These simulations are provided for illustrative purposes only and are based on historical market data and the assumptions shown above. They are not actual trading results and do not predict future performance. Trading involves risk, including the risk of loss. Individual results will vary. General advice only. Past performance is not indicative of future results.
Built for Stage 2 and Stage 3 Investors. Not for Everyone.
This Is For
- Investors in the 10-15 years before retirement who want growth with rules-based capital protection.
- Retirees who cannot afford a major bear market, but also cannot afford to lose quietly to inflation.
- People who want a structured, repeatable process instead of a daily decision.
- Investors who can give about 15 minutes per week to a predefined process.
- SMSF or personal portfolio investors who want a transparent satellite growth strategy.
This Is Not For
- Complete beginners with no brokerage or market experience.
- Stage 1 investors under 55 seeking aggressive growth as their main objective.
- Investors looking for passive, fully automated, zero-involvement investing.
- Anyone who needs certainty before starting. Certainty is not available; process is.
- Anyone unwilling to follow predefined rules when a trade feels uncomfortable.
Real money. Real drawdowns. Measured against the index.
Real money, traded live on the ASX since 31 December 2015. Ten years and eight months, 378 closed trades, through two bear markets, a pandemic crash and a full interest-rate cycle.
Performance — SPA3 Investor — ASX
Returns
| Period | Portfolio | All Ords |
|---|---|---|
| 1 month | +0.18% | +0.64% |
| 3 months | +6.83% | +3.69% |
| 6 months | −13.31% | −0.67% |
| 1 year | −6.81% | +4.13% |
| 3 years p.a. | +5.34% | +11.01% |
| 5 years p.a. | +0.74% | +7.64% |
| 10 years p.a. | +10.23% | +9.37% |
| Since inception p.a. | +10.40% | +9.22% |
| Inception date | 31 Dec 2015 | — |
| Starting capital | A$80,000 | — |
SPA3 Investor — ASX versus All Ords Accum.. Portfolio +187.53%, index +156.57%. Full figures are in the tables on this page.
Risk and return vs the index
Head to head
| Measure | Portfolio | All Ords |
|---|---|---|
| Annualised return | 10.40% | 9.22% |
| Maximum drawdown | −22.70% | −35.93% |
| Max drawdown date | 20 Jun 2022 | 23 Mar 2020 |
| Current drawdown | −13.33% | −2.57% |
| Risk : Reward — lower is better | 2.18 | 3.90 |
| Longest time underwater | 1,174 days | — |
| Return on capital | 187.53% | 156.57% |
The edge mechanics
The decade works. The last five years have not.
Over the full ten years and eight months the portfolio compounded at 10.40% a year against the index's 9.22%, and it did so with a worst-ever fall of 22.70% against the index's 35.93% in March 2020. That is the case for the system, and it still stands.
The recent record is a different story and we are not going to bury it. Over the past five years the portfolio returned 0.74% a year against the index's 7.64%; over three years, 5.34% against 11.01%; over the past twelve months it is down 6.81% while the index is up 4.13%. It sits 13.33% below its March 2026 peak and has spent as long as 1,174 consecutive days below a previous high.
Fewer than four trades in ten close profitable. The ones that work are held 2.9 times longer than the ones that don't — 125 days against 43 — and that gap is the entire mechanism. It does not produce a positive result in every window, and the last few years are the proof of that. What the rules control is how deep a drawdown is allowed to get and how it is exited, not when the market decides to reward the approach.
How the edge actually works
Where every trade landed
All 378 closed trades, grouped by result. The tall bar is the point: most losses are small ones.
How long each kind was held
Winners are held 2.9× longer than losers. Nothing decides that but the rules.
Most trades lose a little. A few win a lot. The system's only job is to make sure the second group is held long enough to outweigh the first — which is why the win rate can sit below 50% and the portfolio still compounds.
The best trades and the worst trade
Closed trade record
| Instrument | Entry | Exit | Held | Result % | Result $ |
|---|---|---|---|---|---|
| ALL Aristocrat Leisure Limited | 14 May 2026 | 21 Aug 2026 | 99 d | +18.39% | +A$4,252.78 |
| CPU Computershare Limited | 21 May 2026 | 19 Aug 2026 | 90 d | +17.36% | +A$3,951.20 |
| JBH JB HI-FI Limited | 5 May 2026 | 18 Aug 2026 | 105 d | −7.52% | −A$1,709.35 |
| SGH SGH Limited | 8 May 2026 | 14 Aug 2026 | 98 d | +1.39% | +A$323.91 |
| ALQ ALS Limited | 20 May 2026 | 27 Jul 2026 | 68 d | −8.27% | −A$1,895.75 |
| WOR Worley Limited | 31 Mar 2026 | 26 Jun 2026 | 87 d | −3.50% | −A$857.00 |
| BHP BHP Group Limited | 8 May 2026 | 25 Jun 2026 | 48 d | +2.12% | +A$489.18 |
| DMP Domino's Pizza Enterprises Limited | 26 May 2026 | 3 Jun 2026 | 8 d | −9.42% | −A$2,092.56 |
| REA REA Group Ltd | 9 Mar 2026 | 25 May 2026 | 77 d | −10.39% | −A$2,175.75 |
| SBM St Barbara Limited | 13 Apr 2026 | 21 May 2026 | 38 d | −22.68% | −A$5,512.26 |
| WBC Westpac Banking Corporation | 15 Aug 2025 | 12 May 2026 | 270 d | −0.68% | −A$154.61 |
| WOW Woolworths Group Limited | 31 Oct 2025 | 11 May 2026 | 192 d | +17.85% | +A$4,688.83 |
The System Does Not Predict. It Responds.
Prediction is a distraction. SPA3 Investor gives you a process that responds to what the market is actually doing.
Scan for signals
Run the pre-set scan in Beyond Charts or use alerts to check ASX and/or USA stocks and ETFs for new entry and exit signals.
Enter on ATR Breakout
When a confirmed entry signal appears, you open the position. The system identifies the stock. Your job is execution.
Allocate equally
Each new position receives an equal share of the capital allocated to that portfolio. ASX and USA portfolios stay separate.
Monitor open positions
ATR Trailing Stop and swing chart pattern indicators track the stock and signal when the trend is weakening.
Exit on signal
When an exit fires, the trade is closed according to the rules, without reopening the decision after the signal.
Sit in cash if required
If all positions close, the portfolio waits in 100% cash until new entry signals appear.

In The Markets Since 1990. 8,000+ Documented R&D Hours.
Gary Stone has spent decades building rules-based systems. The edge is not knowing more than everyone else. It is having a process you can execute when others lose discipline.
Common Questions About SPA3 Investor
What markets does SPA3 Investor cover?
SPA3 Investor scans ASX stocks, ASX ETFs, USA stocks, and USA ETFs. Members can run an ASX-only portfolio, a USA-only portfolio, or both as separate portfolios. Research shows 6-10 positions for ASX and 9-14 positions for USA are optimal. The two markets should never be mixed in a single portfolio.
How is SPA3 Investor different from a managed fund?
Unlike a managed fund, SPA3 Investor puts you in control. You execute every trade based on mechanical rules, and you pay a flat subscription fee rather than a percentage of assets. Every rule is visible in Beyond Charts. There is no black box.
What is Sequence of Returns Risk?
It is the risk that a major bear market occurs just before or during retirement, permanently impairing your plan. SPA3 Investor uses market timing: systematic exits when trends break, to reduce exposure during high-risk periods.
How much time does it take each week?
Once learnt, approximately 15 minutes per week. You run the scan, check open positions for exit signals, check for new entry signals, and execute any required trades. The system does the analysis; your job is execution.
What if I have no prior trading experience?
SPA3 Investor can suit investors with limited market experience, but all new users are encouraged to begin with a small capital allocation during a training-wheel period. The objective at the start is to build skill and process, not maximise returns.
Find Out If This Is the Right Fit.
Start With the Free Discovery Series
Gary's 7-part PBYP Series explains the full system, the process, and whether this suits your stage of life and capital. Watch the PBYP Series free — no commitment required.
Watch the PBYP Series